Country-Aggregated Data: an Overview
This website contains national aggregates for precipitation (rainfall) and for the Palmer Drought Severity Index (pdsi), for possible use in economics research. Data were constructed from gridded climatology datasets, using various weighting schemes as described below.
We use Mitchell's CRU TS 2.0 dataset which gives
historical monthly values at 0.5 degree resolution over global land mass. The
underlying data are weather-station observations, which have been interpolated
onto a global grid as described by Mitchell. Please see Mitchell's website
at http://www.cru.uea.ac.uk/~timm/ for more information, and our Rainfall page for appropriate source references.
For boxid i = 1, ..., I and countries j = 1, ..., J, let A(ij) be the area within boxid i that is enclosed in country j. Let C(i) and RM(i) be the crop extent index and long-run average rainfall for boxid i. Finally, let R(i) be rainfall for boxid i. Then for each month:
Area-weighted rainfall for country j = Sum over all i of areashare(ij)*rain(i), where areashare(ij) = A(ij)/[Sum over all i of A(ij)].
Crop-weighted rainfall for country j = Sum over all i of cropshare(ij)*rain(i), where cropshare(ij) = C(i)*A(ij)/[Sum over all i of C(i)*A(ij)].
Rain-weighed rainfall for country j = Sum over all i of rainshare(ij)*rain(i), where rainshare(ij) = RM(i)*A(ij)/[Sum over all i of RM(i)*A(ij)].
Note that by construction the weights sum to 1 over all i.
1.2 Area-weighted rainfall data
The political map underlying Dr. Mitchell’s CRU TS 2.0 data and our own political map appear to differ in some respects. Here we briefly describe the discrepancies, to the degree possible in the absence of a direct comparison of the two political maps. This sketch is necessarily rough but does provide some insight.
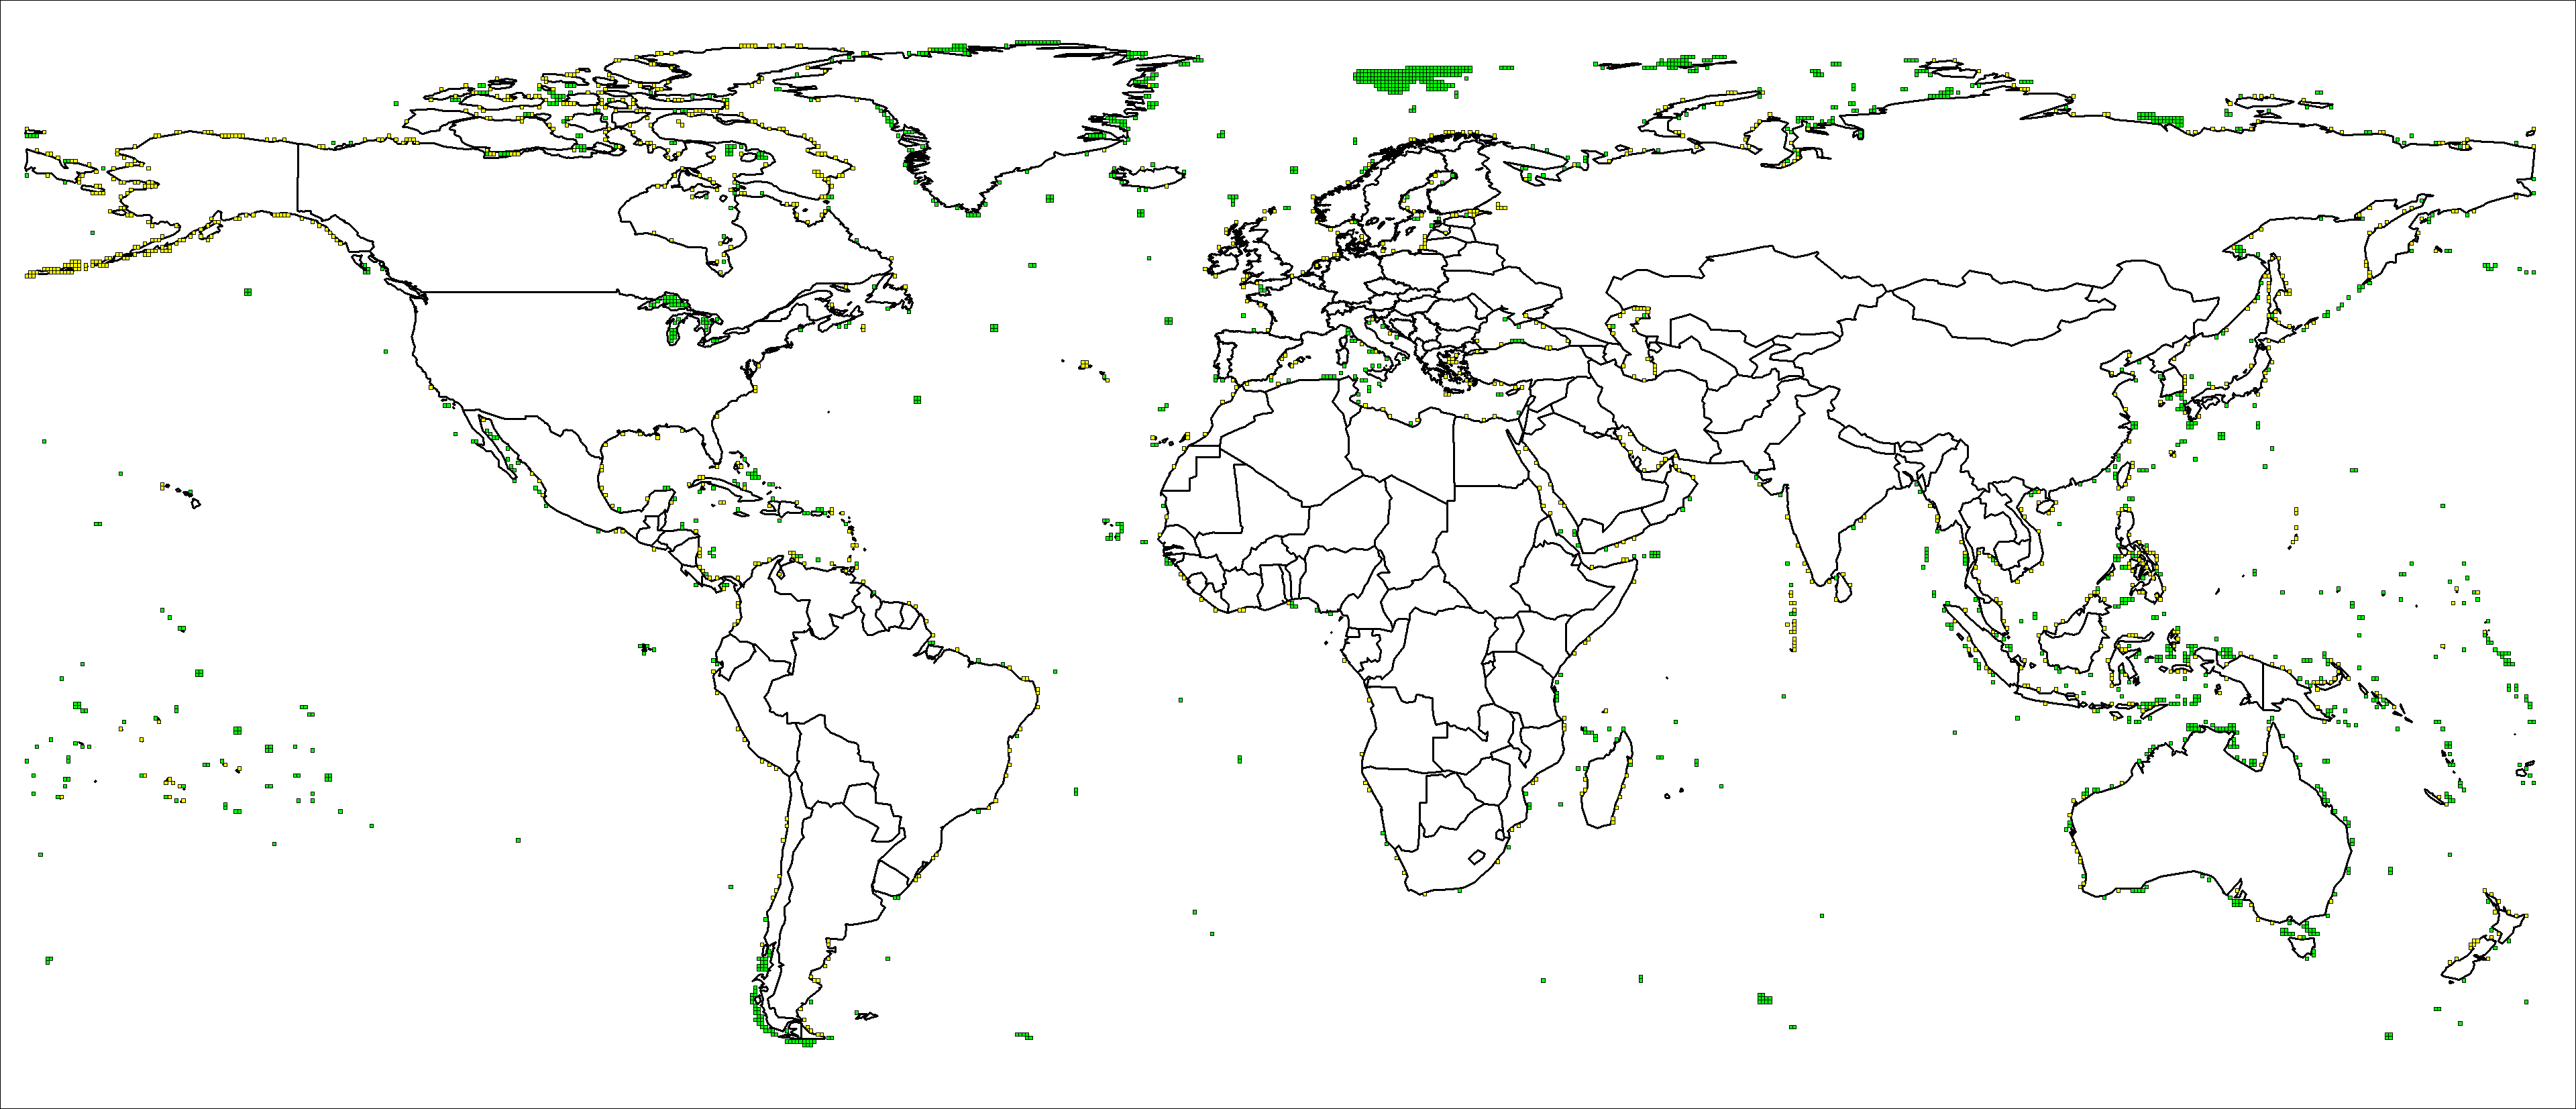
First, plots of two different types of grid box provide a visual illustration of where maps disagree. The first type contains rainfall data where we have no land, and the second contains land area for which we have no rainfall data. Because Mitchell provides rainfall data over for gridboxes that contain land on his political map, a grid box containing rainfall data but no land area (green) suggests a region where land exists in Mitchell’s map but not in ours. Similarly, a box containing land area for which we have no rainfall data (yellow) suggests our map has land where Mitchell’s does not. Both types of box overlaid over a political map appear in Figure 1. Plots of such grid boxes do not reveal any systematic clustering, but rather, a semi-even distribution around continent borders, which suggest general differences of borders in the maps used rather than grid misplacement or accidental shifts of a political map.
Second, mathematical measures provide further characterization of discrepancies. First, ratios of total land area with rainfall data over total land area in a given country are fairly high, with a mean of 0.9738 across countries and a standard deviation of 0.0088. Without Dr. Mitchell's map, we cannot calculate more definitive ratios, which could provide further insight into the discrepancies. Second, Table1 contains measures of differences between our country aggregates and those calculated by Dr. Mitchell (we report country-by-country long-run means and standard deviations of rainfall, as well as the mean and standard deviation of the percentage difference between our aggregates and Dr. Mitchells). Not surprisingly, these indicate that discrepancies in the political maps are largest for small islands and/or archipelago countries, where border differences are most likely to be large relative to total area. For example, on our own map, Tonga lies just slightly east of the grid box containing the relevant Mitchell data; our own weighting scheme therefore assigns no CRU TS 2.0 data to Tonga, which is reported in our table as having missing data. Other small islands are similarly distorted even where the maps correspond closely enough that some Mitchell data are available. Chile is one of the few "larger" countries for which there is a substantial discrepancy between the two maps.
1.3. Cropland-Weighted Rainfall Data
We use the Ramankutty and Foley (1998) cropland extent data (see our Rainfall page for the full reference), including the updates described in http://www.sage.wisc.edu/download/crop92/croplands.html. The index combines a) Seasonal Land Cover Regions (SLCR) data for 1992 (Loveland and Belward, 1997), which is derived from advanced very high resolution radiometer (AVHRR) data, with b) land cover inventory data, which comes from various sources such as the United States Department of Agriculture (USDA). To create the index, the SLCR data are first reduced to six aggregate categories implying monotonically increasing prevalence of cropland. Those categories are (0) other vegetation, (1) other vegetation with crops, (2) other vegetation/crop mosaic, (3) crop/other vegetation mosaic, (4) crops with other vegetation, and (5) crops. The land cover inventory data are then used to infer cropland weights for each of the six categories, on a continent-by-continent basis, with the objective of reproducing as closely as possible the actual country-by-country cropland coverage as indicated in the inventory data. In this procedure, crop coverage is allowed to range in 0.05 increments from 0.0 to 1.0, where 0.0 pertains exclusively to other vegetation and 1.0 to all crops.
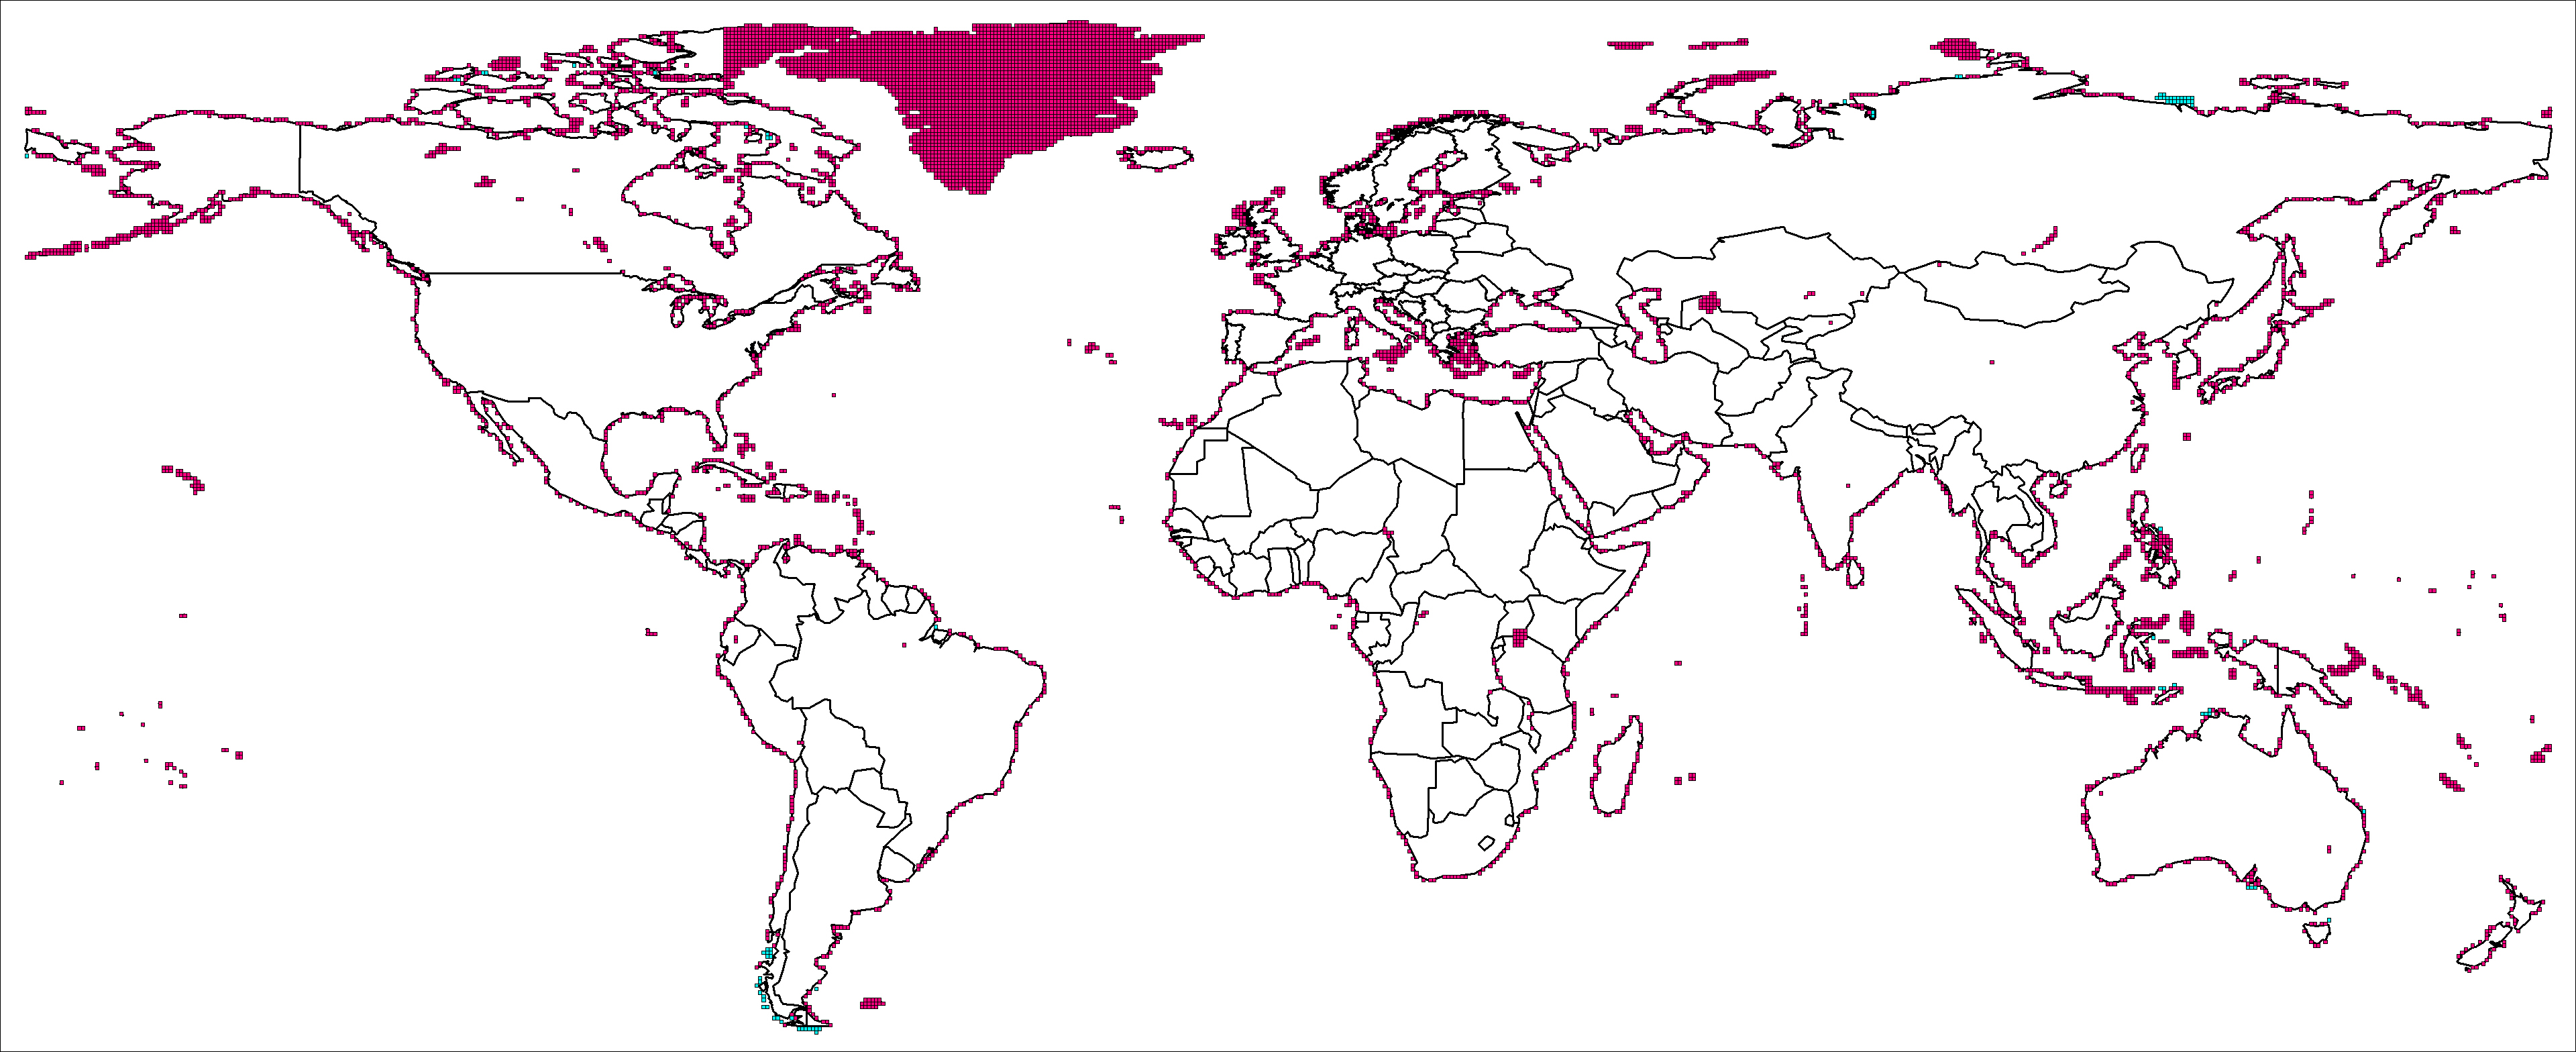
Plots of two different types of grid box provide a visual illustration of where political maps may disagree. The first type of box contains index data where we have no land (cyan), and the second contains land area for which we have no index data (pink). Both types of box overlaid over a political map appear in Figure 2. Ratios of total area of grid boxes containing cropland indexes and rainfall data over total area of grid boxes appear in Table 1.
1.4 Rain-weighted rainfall data
For purposes of assessing agricultural drought, the Palmer Drought Severity Index (PDSI) offers a more sophisticated approach than one based on rainfall alone. The PDSI takes into account not only rainfall, but also soil conditions and temperature as they affect the moisture available to plants. A PDSI of -3.0 or less indicates severe drought; a PDSI of +3.0 or greater indicates severe 'moisture surplus.' We present national aggregates of Trenberth's gridded PDSI indexes at a 2.5 degree resolution for 1940-1995. Please see Trenberth's website at http://www.cgd.ucar.edu/cas/catalog/climind/pdsi_old.html for more information on the nature and interpretation of these indexes.
The spatial coverage of the Trendberth PDSI dataset is often sparse (see his readme file), with many gridboxes missing completely. For aggregation to national borders, we retained all gridboxes with at least 90 percent of monthly values available for the full 1940-1995 period. For these gridboxes, we interpolated missing monthly values using the corresponding long-run monthly mean. Cropland-weighted PDSI country-aggregates have been calculated for only for African countries.
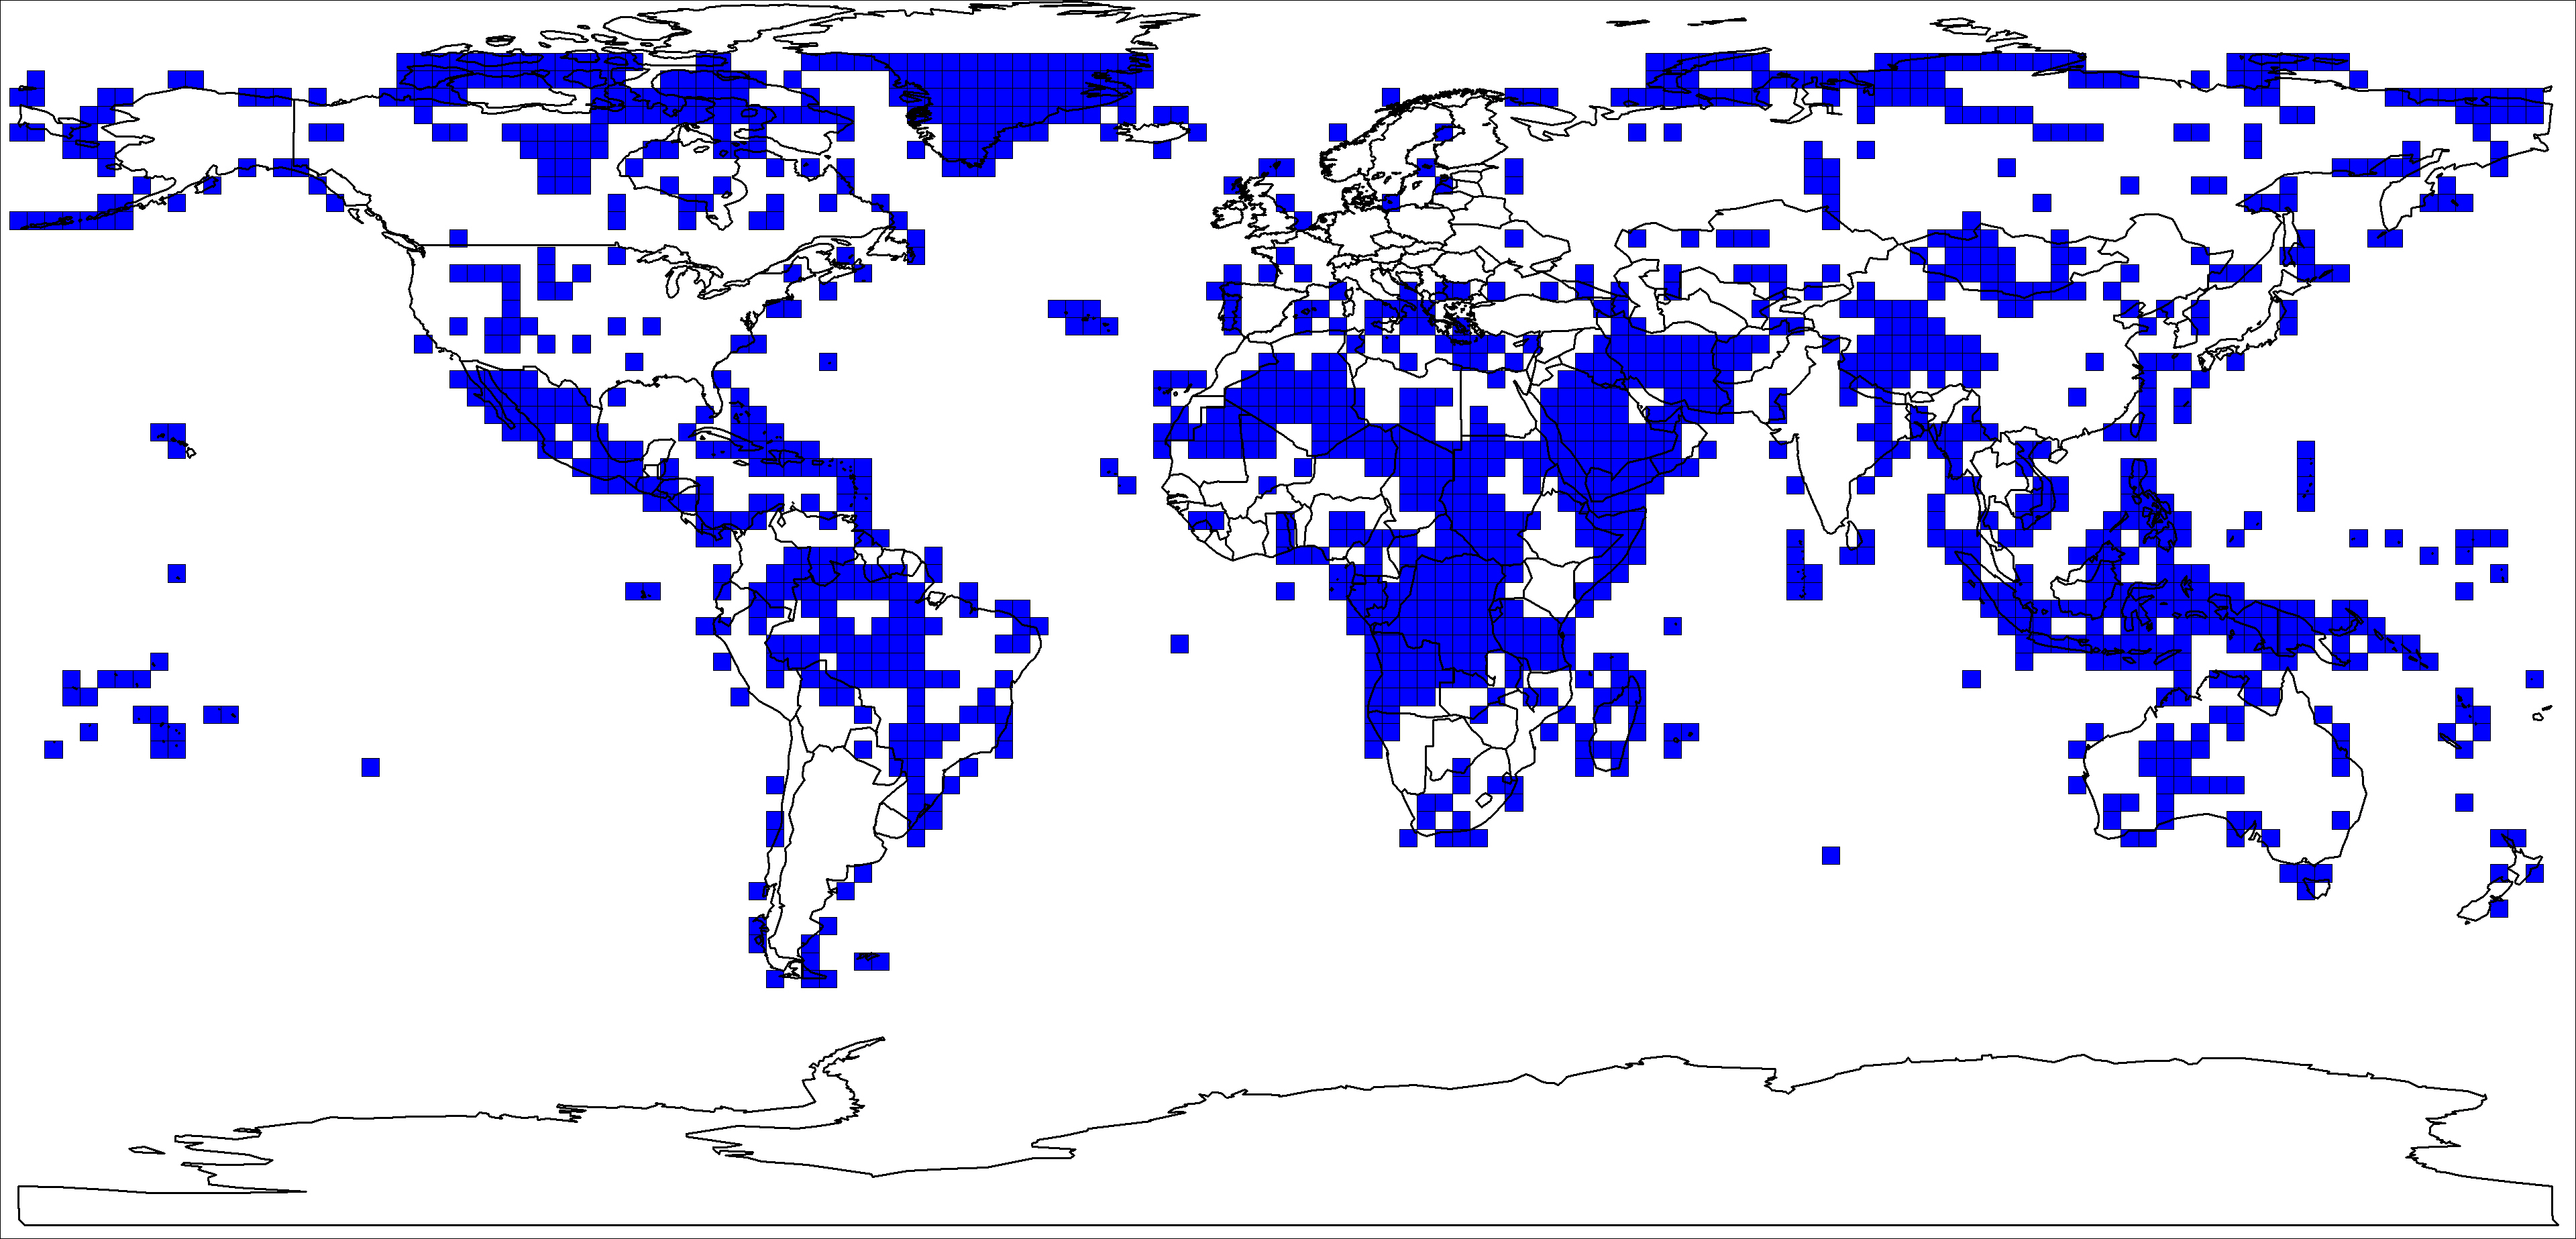
Figure 3 provides a map showing boxes where PDSI data are not available. (There were no boxes with PDSI data but without land area.) Ratios of total land area with PDSI data over total land area in a given country are fairly low, with a mean of 0.6503 across countries and a standard deviation of 0.3181; these ratios are presented in Table 2. The area-weighting formula is identical to that used for the Mitchell rainfall data.
2.2 Crop-weighted PDSI data (for Africa only).
To calculate crop-weighted aggregates we first calculated an area-weighted crop extent index for each of the PDSI gridboxes, and then calculated the area-weighted average of these modified PDSI values. There was no land area where PDSI data were available but cropland data were not. For information on cropland extent data, see 1.3 Cropland-weighted rainfall data.
Rainfall Data∙ ∙ ∙ ∙PDSI Data